An infographic is a graphical representation of information. They are commonly used to present data in a visually appealing way, making complex information more understandable and digestible. Infographics can be used for a wide variety of topics, from scientific data to social media statistics to just whatever topic under the sun. When done well, infographics can be extremely effective at conveying information in a clear and engaging way.
Types and Infographic Samples
1. The Timelines Infographic
A timeline is a graphical representation of a chronological sequence of events. It can be used to visualize historical data, track the progress of a project, or simply provide an overview of important events. Timelines are often very helpful in understanding complex processes or when trying to grasp the big picture. An infographic timeline is a great way to present this information in an easy-to-understand format. This type of graphic can be used to show the evolution of a company, highlight key moments in history, or even map out the steps in a recipe.
2. The Flowchart Infographic
Flowcharts allow you to depict the steps in a process in a visual way. They can be used for everything from explaining how to use a product to illustrate the different stages of a marketing campaign. It uses images and symbols to show the steps in the process that are helpful in understanding complex processes or concepts.
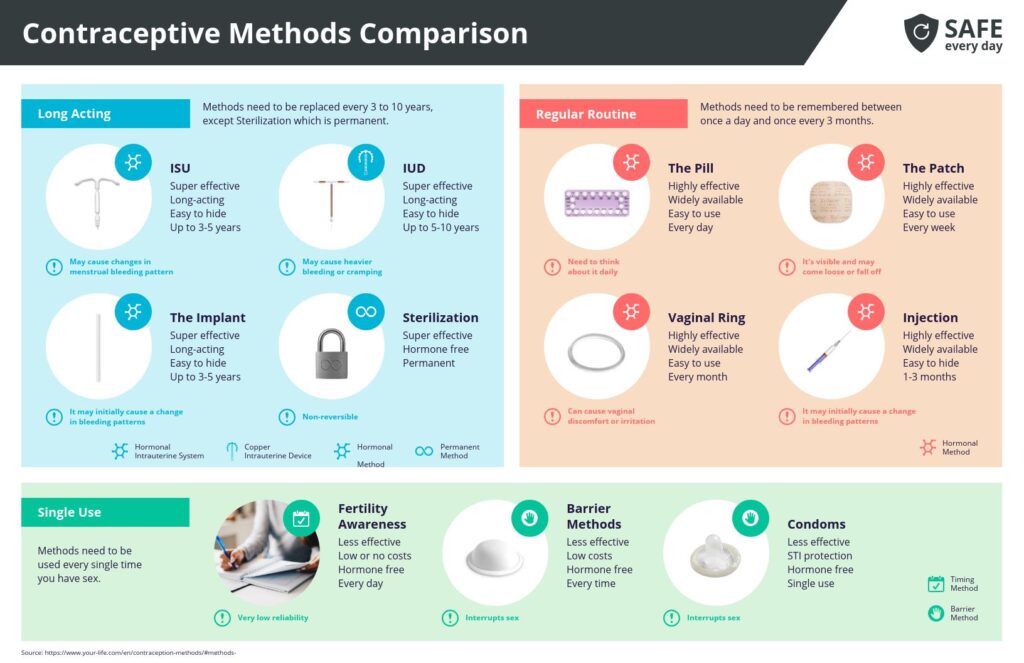
3. The Comparison Infographic
Comparison infographics are perfect for illustrating the pros and cons of two (or more) options or items. This can be useful for comparing data, products, or anything else where you want to see the differences side by side. These infographics usually have a left and right side, with each item being represented on one or the other. They can be used when making decisions about anything from what car to buy to which vacation package is the best deal.
4. The Map Infographic
A map infographic is a graphic representation of data or information that is displayed on a map. This type of infographic is used to visualize data in order to see patterns, trends, and outliers. Map infographics can be used to display data about anything that can be geographically located such as places, businesses, events, etc. By using a map, readers can quickly see where the data is coming from and how it is distributed. It can be used, for example, to show the location of various points of interest or to illustrate the spread of a contagion. They can also be used to show the results of a poll or survey.
![]()
5. The Data Visualization Infographic
Data visualization infographic is a pictorial or graphical representation of data or information. It can be used to show the results of surveys, studies, and experiments, as well as to track changes in various trends over time. Data visualizations are often used to make complex data more understandable and easier to digest. They can also help people see relationships and patterns that might not be apparent from just looking at the raw data. There are many different types of data visualizations, but some of the most common ones include bar graphs, line graphs, pie charts, and maps.
6. The How-To Infographic
How-to infographic is a step-by-step guide that visualizes a process. It usually contains text and illustrations to make the steps clear. They can walk them through how to do something, how something works, or even how to make something.

Venngage
7. The Fun Infographic
Not all infographics have to be serious! Sometimes it can be fun to create an infographic that is just plain entertaining. This could be a list of the funniest movies of all time, the most popular memes, or the oddest items ever found in a person’s stomach.
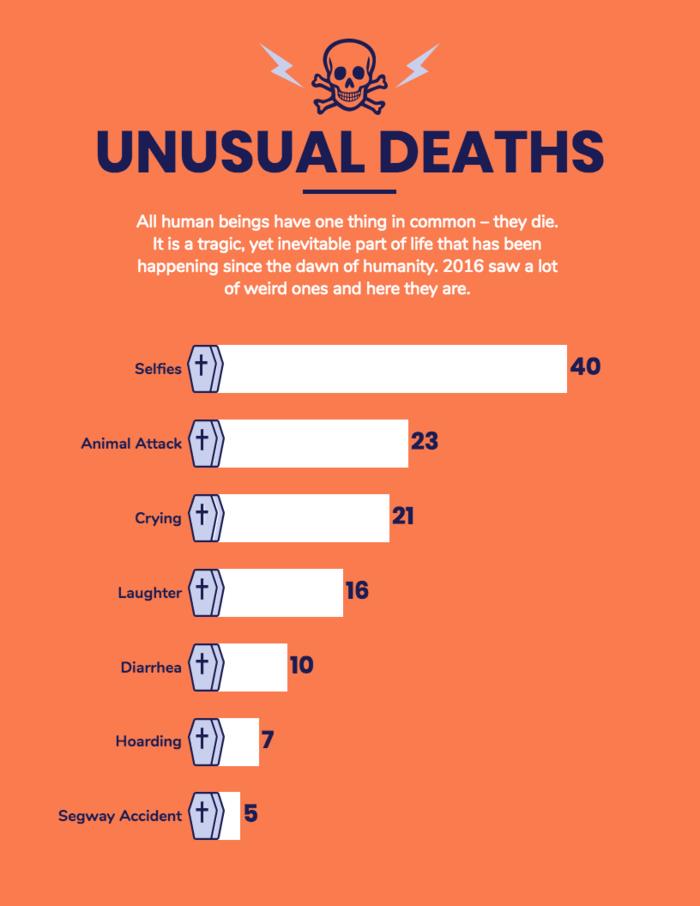
Venngage
8. The Viral Infographic
Viral infographics are those that are passed around the internet like wildfire. They often contain shocking or surprising information and/or graphics that are sure to grab attention.
9. The Educational Infographic
Educational infographics are designed to teach readers about a particular topic. They can be used in a variety of settings, from classrooms to corporate training seminars.
10. The Marketing Infographic
Marketing infographics are used to promote a product or service. They typically contain data that supports the product or service and any claims that are being made.
Venngage is a free infographic maker and offers free infographic templates for whatever you need!
Venngage is an online infographic maker that offers a wide range of templates for free, making it easy to get started on creating your own infographics. With Venngage, you can create infographics about anything from marketing data to social media statistics. Signing up with Venngage is fast and easy, so be sure to check them out today and start creating beautiful and informative infographics